Pharmacoeconomics 101: Core Concepts, Methods, and Practice in Türkiye
Prof. Dr. F. Cankat Tulunay
Honorary President, EACPT (European Association for Clinical Pharmacology and Therapeutics), Chair, Türkiye Rational Use of Medicines Platform
Abstract
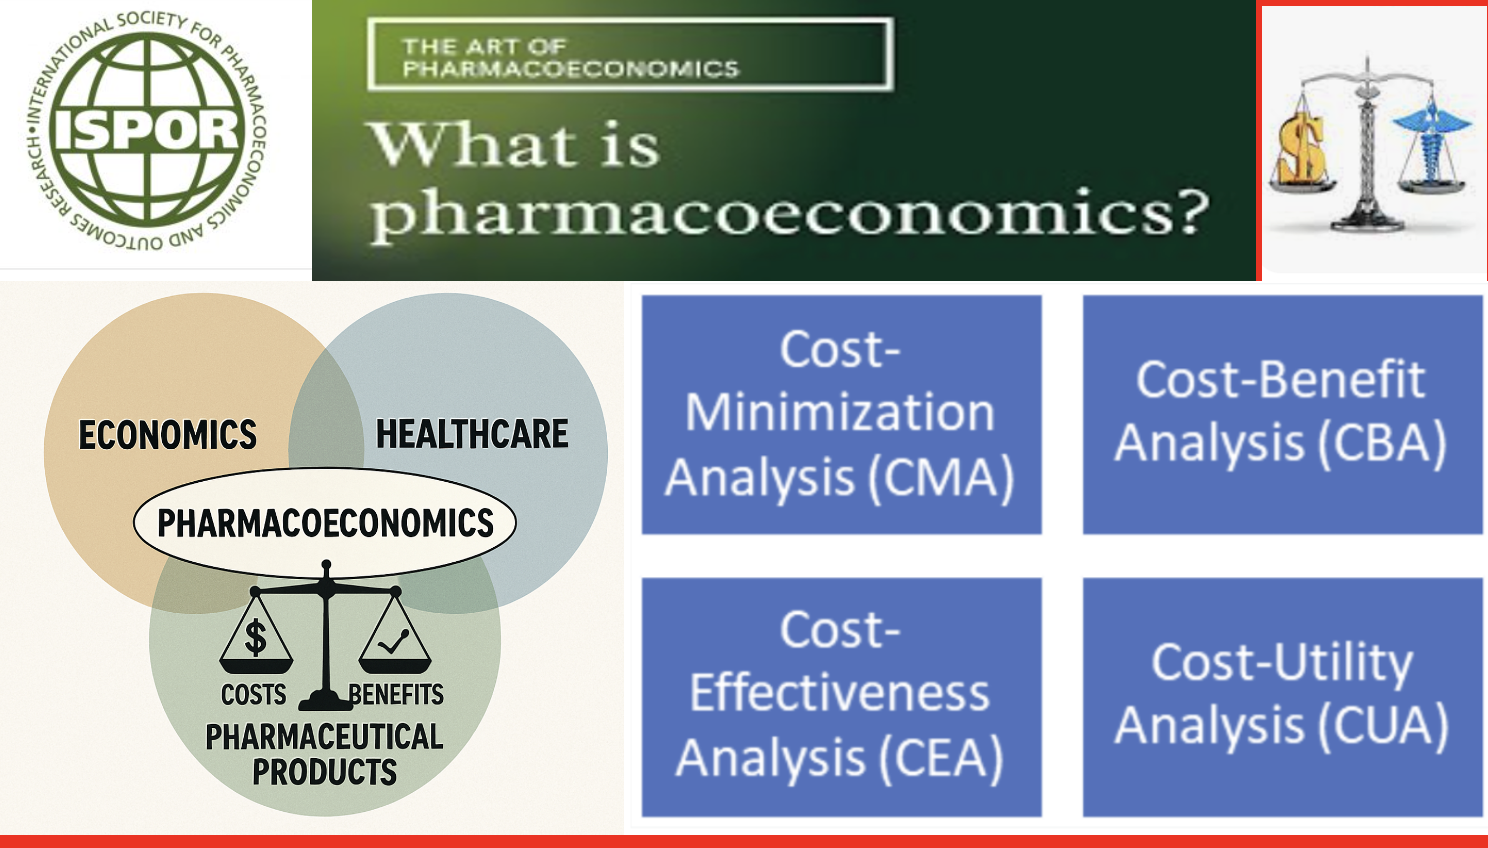
Pharmacoeconomics is the discipline that evaluates the costs and health benefits of medicines and other health technologies under a limited health budget to answer the question, “Is the change worth it?” It provides evidence for reimbursement, pricing, and treatment choice decisions by payers, regulators, and clinicians. Pharmacoeconomic analysis is a set of methods used to assess the costs and effectiveness of health interventions (medicines, treatments, medical devices, etc.). These analyses aim to ensure efficient use of health resources and guide decision-makers (physicians, health-policy makers, insurers). Pharmacoeconomic methods are commonly examined under four main headings.
Contributions to the Institutionalization of Pharmacoeconomics in Türkiye
- The Clinical Pharmacology Association played a pioneering role in initiating early work and education that helped institutionalize pharmacoeconomics in Türkiye. At various national and international meetings it organized, participation was secured from SGK (Social Security Institution) officials, TİTCK (Turkish Medicines and Medical Devices Agency) administrators, members of the Turkish Grand National Assembly Health Committee, representatives of the pharmaceutical industry, and academics.
In 2002 I attended the ISPOR congress alone; after establishing the ISPOR Türkiye Chapter, we attended with dozens of colleagues and delivered multiple presentations. As a result of our efforts, I received the ISPOR Distinguished Service Award at the 13th ISPOR European Congress in Prague, November 2010, for service as Program Chair. Further details of our work on pharmacoeconomics in Türkiye can be found in my biography. - Within ISPOR Türkiye and in various national meetings (since 2008), we proposed using 1–3× GDP per capita per QALY as a reference threshold for ICER in reimbursement decision-making.
- This approach has been widely adopted among health economists and academia.
- In meetings and with institutions, we advocated for transparent cost-effectiveness presentation in HTA dossiers, inclusion of Budget Impact Analysis (BIA), and the use of real-world evidence (RWE).
1. Introduction
Pharmacoeconomic analysis aims for the efficient and equitable use of health resources. Medicines, medical devices, diagnostic tests, and service models are compared across cost, effectiveness, health-related quality of life, and budget impact dimensions.
2. Core Analysis Methods
2.1 Cost-Effectiveness Analysis (CEA)
Purpose: Compares the incremental cost and incremental health outcome of an intervention. Natural units are often used (e.g., life-years gained, reduction in stroke risk, prevention of complications).
Measurement: Expressed as cost per unit of effectiveness (e.g., TL per life-year, TL per stroke averted). QALY may be used, but “classic” CEA relies on natural health measures.
Use cases: Comparing medicines/devices for the same disease; ranking treatment options in guideline development.
Examples:
- Antithrombotics: cost per stroke prevented.
- Oncology regimen: incremental life-years gained vs standard care.
Strengths: Clinically intuitive; widely accepted for comparative treatment analyses.
Limitations: Does not reduce health outcomes to a single common metric (like QALY), making cross-disease comparisons harder.
2.2 Cost-Benefit Analysis (CBA)
Purpose: Expresses both costs and benefits in monetary terms, reporting net benefit or benefit-cost ratio (BCR).
Measurement:
- Benefit = avoided healthcare costs + productivity gains + monetary valuation of life-years gained.
- Net benefit = Total benefit − Total cost.
Use cases: Comparing health programs with other public investments (transport, education); macro-level resource allocation.
Examples: - Vaccination program: spending vs avoided treatment costs + reduced absenteeism.
- Smoking-cessation campaign: savings in medical care + productivity gains.
Strengths: Enables cross-sector comparison; produces a direct economic result (net benefit or BCR).
Limitations: Monetizing health benefits is challenging (VSL/WTP methods debated); ethical concerns about “pricing life.”
2.3 Cost-Minimization Analysis (CMA)
Purpose: Among interventions with equivalent clinical effectiveness, chooses the lowest total cost option.
Measurement: Costs only.
Use cases: Generic vs originator drugs; biosimilars with proven equivalence.
Examples:
- Generic vs originator atorvastatin cost comparison.
- Two antibiotics with equivalent outcomes but different costs.
Strengths: Simple, fast for decision-makers.
Limitations: Requires robust proof of equal effectiveness; scope is limited because true equivalence is uncommon.
2.4 Cost-Utility Analysis (CUA)
Purpose: Compares costs against outcomes adjusted for quality of life, usually QALY (or DALY).
Measurement: Cost/QALY or cost/DALY.
Use cases: Chronic diseases; conditions with major HRQoL impacts (e.g., RA, oncology, rare diseases).
Example: A new rheumatology biologic’s incremental QALYs and costs vs standard of care.
Strengths: Reduces outcomes to a single common metric enabling comparison across diseases.
Limitations: QALY values depend on culture, instruments, and methods; ethical debates (QALY may undervalue older/disabled populations).
2.5 Complementary Approaches
Budget Impact Analysis (BIA): Short- to mid-term payer budget impact of adopting a new technology. Example: Five-year SGK budget impact after listing a new cancer drug.
Cost of Illness (COI): Total societal cost of a disease (direct medical + indirect productivity + intangible). Provides baseline inputs for pharmacoeconomic work. Example: Annual cost of diabetes in Türkiye.
3. QALY: Quality-Adjusted Life Year
Definition: QALY summarizes length of life and quality of life (utility 0–1) in a single metric.
- 1.0: perfect health; 0.0: death; intermediate values reflect health states.
Calculation:
QALY=Years of Life×Utility (0–1)
Illustrative scenarios:
- 1 year in perfect health: 1×1.0=1
QALY
- 5 years with chronic pain (utility 0.6): 5×0.6=3
QALY
- 10 years bedridden (utility 0.2): 10×0.2=2
QALY
Uses: Comparing health gains across interventions; benefit term in ICER.
Advantages: Captures both quantity and quality; allows cross-disease comparisons.
Limitations: Utilities vary by population, culture, and instrument; potential equity concerns.
4. ICER: Incremental Cost-Effectiveness Ratio
Definition & formula: Compares incremental cost and incremental QALY of a new intervention vs comparator.
ICER=C1-C0E1-E0=ΔCostΔQALY
Interpretation: Cost per one additional QALY. If ICER is below the country-specific threshold (λ), the intervention is deemed cost-effective.
Numerical example:
Comparator: 10,000 TL; 1.2 QALY. New: 50,000 TL; 1.5 QALY.
ICER = (50,000 − 10,000) / (1.5 − 1.2) = 133,333 TL/QALY.
Use cases: Reimbursement evaluations for new medicines; “Is it worth the change?” in policy.
Strengths: Jointly considers cost and benefit; internationally standardized.
Limitations: Not sufficient alone—disease severity, budget impact, and evidence quality also matter.
5. Threshold (CET, λ): How Is It Determined?
Definition: The maximum a health system is willing to pay per QALY gained.
Approaches:
- GDP-multiple (WHO-CHOICE): 1–3× GDP per capita.
- Opportunity cost: Empirical marginal QALY productivity of the health budget.
- Willingness to pay (WTP): Survey-based societal values.
- Reference country comparison: PPP-adjusted adaptation from similar systems.
- Policy choice: Practically declared range by national bodies.
International examples (indicative):
- UK (NICE): £20,000–£30,000/QALY
- USA (practice by ICER Institute): $100,000–$150,000/QALY
- Spain: €22,000–€25,000/QALY
- China: ~1.2–3× GDP per capita
- Global averages (174-country analysis, Lancet 2023):
- High-income ≈ $18,200/QALY
- Upper-middle ≈ $4,300/QALY
- Lower-middle ≈ $745/QALY
Türkiye:
- No official fixed threshold.
- Policy discussions commonly reference 1–3× GDP per capita per QALY.
- 2024 GDP per capita ≈ $13,383 (~₺440,000).
- Implied reference band ≈ ₺0.43–1.3 million/QALY.
Note: CET is a guide; decisions also consider severity, alternatives, budget impact, and ethics.
6. ICER and Reimbursement Practice in Türkiye
6.1 Workflow
- Define target population and comparators.
- Estimate QALY gains (e.g., EQ-5D).
- Compile Türkiye-specific unit costs (drug, follow-up, AEs, hospitalization).
- Calculate ICER and compare to λ.
- Conduct BIA with uptake scenarios.
6.2 Threshold Debate
While no official threshold is declared, 1–3× GDP per capita per QALY is commonly referenced. With 2024 GDP per capita ≈ $13,383 (~₺440,000), a working band of ₺0.43–1.3 million/QALY is often used. Real-world decisions also reflect severity, innovativeness/alternativelessness, total budget impact, and ethics.
6.3 Institutional Process
SGK committees (clinical pharmacologists/physicians, pharmacists, health economists, legal experts) assess submissions. HTA dossiers must include effectiveness–safety, CEA/CUA, BIA, and sensitivity analyses, with transparent reporting and appropriate evidence quality.
7. Value-Based Pricing (VBP)
Core idea: Price reflects health value, not production cost. Decision metrics: ICER or Incremental Net Benefit (INB).
- INB: INB=λ×ΔE-ΔC
; if INB > 0, the technology has value.
- Price cap example: Comparator annual cost ₺5,000; incremental effect 0.05 QALY; care-cost savings ₺2,000; threshold λ=₺200,000/QALY
.
Pmax=5,000+(200,000×0.05)+2,000=₺17,000
7.1 Implementation Elements
HTA dossier (clinical, CEA/CUA, BIA); RWE to manage uncertainty; MEA (risk-sharing/outcomes-based, price-volume, budget caps); MCDA for severity, rarity, and equity.
7.2 Strengths & Limitations
Pros: Directs resources to higher health gain; transparent, defensible decisions.
Cons: Debates on QALY and λ; uncertainty in rare/small populations; need for RWE/MEA.
8. Uncertainty & Sensitivity Analysis
Deterministic (one-way/multi-way) and probabilistic (PSA) analyses are recommended. CEACs depict acceptance probabilities across λ values. Results are sensitive to time horizon, discount rate, and perspective (payer vs societal).
9. Short Case Examples
- ICER: New drug 50,000 TL; 1.5 QALY vs comparator 10,000 TL; 1.2 QALY ⇒ 133,333 TL/QALY; acceptable if below λ.
- VBP price cap: Using parameters above, ₺17,000.
10. Abbreviations
QALY — Quality-Adjusted Life Year; DALY — Disability-Adjusted Life Year; ICER — Incremental Cost-Effectiveness Ratio; CET/λ — Cost-Effectiveness Threshold; NMB/INB — Net Monetary Benefit/Incremental Net Benefit; HRQoL — Health-Related Quality of Life; BIA — Budget Impact Analysis; HTA — Health Technology Assessment; MEA — Managed Entry Agreement; MCDA — Multi-Criteria Decision Analysis
Appendix: Essentials for Pharmacoeconomic Dossiers in Türkiye
- Are comparators aligned with real clinical practice?
- Are utility sources (e.g., EQ-5D) and value sets adapted to Türkiye?
- Are unit costs from current national tariffs?
- Does the time horizon cover the natural history of disease?
- Are discount rate and perspective stated?
- Is PSA included with CEACs?
- Does the BIA include population and uptake scenarios?
- Are MEA/RWE proposals proportionate to uncertainty?
11. References
- Drummond MF, Sculpher MJ, Claxton K, Stoddart GL, Torrance GW. Methods for the Economic Evaluation of Health Care Programmes. 4th ed. Oxford University Press; 2015.
- Neumann PJ, Sanders GD, Russell LB, Siegel JE, Ganiats TG. Cost-Effectiveness in Health and Medicine. 2nd ed. Oxford University Press; 2017.
- World Health Organization. Making Choices in Health: WHO Guide to Cost-Effectiveness Analysis. Geneva: WHO; 2003.
- Claxton K, Martin S, Soares M, et al. Methods for the estimation of the NICE cost-effectiveness threshold. Health Technol Assess. 2015;19(14).
- Pichon-Riviere A, Soto NC, Augustovski F, et al. Thresholds for the cost-effectiveness of interventions: a global analysis across 174 countries. Lancet Glob Health. 2023;11(6):e888–e897.
- ISPOR Türkiye Chapter. Health Economics & Pharmacoeconomics meeting reports (2009–2024).
- ISPOR. Education & Training. https://www.ispor.org/education-training
This article was prepared with AI assistance.

